Processing and Downloading NDVI Data Using Google Earth Engine
When it comes to finding, processing, and downloading NDVI data from various openly available sources online, there are numerous methods at our disposal. Today, I will guide you through one of the most powerful tools for processing and downloading planetary-scale remote sensing data: Google Earth Engine (GEE).
Google Earth Engine is a cloud-based platform developed by Google in 2010. It was created to enable global-scale analysis and processing of geospatial data, particularly for scientific and environmental research. GEE provides access to a vast archive of satellite imagery and geospatial datasets, along with powerful tools for data processing, analysis, and visualization. Its main strengths lie in its ability to handle large datasets, its extensive library of geospatial datasets, and its capability to execute complex computations quickly and efficiently in the cloud. This makes GEE an invaluable resource for remote sensing scientists, environmental researchers, and geospatial analysts.
For those new to GEE and its syntax, I highly recommend reading the book Cloud-Based Remote Sensing with Google Earth Engine. It provides a comprehensive introduction to the platform and its capabilities.
In the past, I have used the USGS and Copernicus websites to download raw satellite imagery from Landsat and Sentinel satellites or NDVI bands. While these sources are reliable, they become cumbersome when dealing with large Areas of Interest (AOI), such as entire countries. Even if we manage to download such vast amounts of data to local computers, processing it can be resource-intensive and time-consuming, rendering the approach inefficient.
Google Earth Engine offers a solution to these challenges, allowing for the efficient processing, analysis, and download of final products, even when working with planetary-scale datasets.
In this blog, I will demonstrate how to process and download monthly mean NDVI data for the year 2023 for Pakistan using the MODIS MOD13A1.061 Terra Vegetation Indices 16-Day Global 500m dataset, which provides data at a 500-meter spatial resolution. We will then process this data locally to create an animated map of seasonal variations in Pakistan.

Loading the Country’s Boundary Data
First, we will load the boundary data for Pakistan. This data has already been added to GEE as an asset.
// Define the region of interest: Pakistan's boundary
var pakistan = ee.FeatureCollection("projects/ee-mohsinramay/assets/pak_adm0");
Loading and Filtering MODIS Data
Next, we will load the MOD13A1.061 Terra Vegetation Indices 16-Day Global 500m dataset from MODIS, focusing on data for the year 2023, and filter it to include only the area within Pakistan’s boundaries.
The MOD13A1 V6.1 product provides Vegetation Index (VI) values on a per-pixel basis. It includes two primary vegetation layers: the Normalized Difference Vegetation Index (NDVI), which serves as a continuity index to the NOAA-AVHRR derived NDVI, and the Enhanced Vegetation Index (EVI), which minimizes canopy background variations and maintains sensitivity over dense vegetation conditions. These indices are computed from atmospherically corrected bi-directional surface reflectances, which have been masked for water, clouds, heavy aerosols, and cloud shadows.
For more detailed information, refer to the official MOD13A1 dataset documentation.
// Load the MODIS Vegetation Indices data for 2023
var dataset = ee.ImageCollection('MODIS/061/MOD13A1')
                  .filterDate('2023-01-01', '2023-12-31')
                  .filterBounds(pakistan);
Selecting the NDVI Band
We will then select only the NDVI band from the dataset.
// Select the NDVI band (Normalized Difference Vegetation Index)
var ndvi = dataset.select('NDVI');
Clipping the NDVI Imagery to Pakistan
To focus on our Area of Interest, we will define a function to clip the NDVI imagery to Pakistan’s boundaries. This function will be used in the subsequent step when calculating the mean NDVI for each month.
// Clip the data to the Pakistan boundary
var clippedNDVI = ndvi.map(function(image) {
  return image.clip(pakistan);
});

// Group NDVI by month and calculate the mean for each month
var monthlyNDVI = ee.ImageCollection.fromImages(
  ee.List.sequence(1, 12).map(function(month) {
    return clippedNDVI
      .filter(ee.Filter.calendarRange(month, month, 'month'))
      .mean()
      .set('month', month);
  })
);
Combining Monthly NDVI Bands
We will now combine the monthly NDVI bands into a single image, where each band represents the mean NDVI for a specific month.
// Combine all monthly mean images into a single image with multiple bands
var combinedMonthlyNDVI = monthlyNDVI.toBands();
Renaming Bands for Later Processing
Next, we will rename the bands according to the month abbreviations, which will facilitate later processing in R. We will also print the combinedMonthlyNDVI data to ensure it aligns with our expectations.
// Corrected band renaming logic using map
var monthNames = ['Jan', 'Feb', 'Mar', 'Apr', 'May', 'Jun', 'Jul', 'Aug', 'Sep', 'Oct', 'Nov', 'Dec'];
var newBandNames = ee.List(monthNames).map(function(name) {
  return ee.String('NDVI_').cat(name);
});
combinedMonthlyNDVI = combinedMonthlyNDVI.rename(newBandNames);

print(combinedMonthlyNDVI)
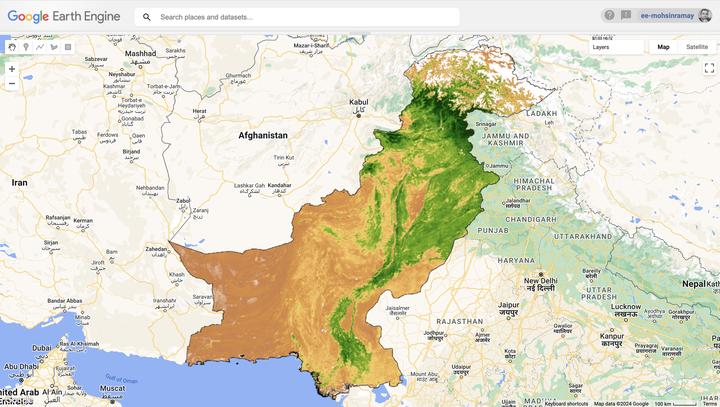
Visualizing the NDVI Data
Now, let’s visualize the NDVI data to inspect its quality. Below is a plot of the mean NDVI for January 2023.
// Set visualization parameters for NDVI
var ndviVis = {
  min: 0.0,
  max: 9000,
  palette: [
    'ffffff', 'ce7e45', 'df923d', 'f1b555', 'fcd163', '99b718', '74a901',
    '66a000', '529400', '3e8601', '207401', '056201', '004c00', '023b01',
    '012e01', '011d01', '011301'
  ],
};

// Add the layer to the map
Map.centerObject(pakistan, 6);
Map.addLayer(pakistan, {}, 'Pakistan');
Map.addLayer(combinedMonthlyNDVI.select('NDVI_Jan'), ndviVis, 'Pakistan NDVI January 2023');
Exporting the Data for Local Processing
Once we are satisfied with the data, we can export the multiband image to Google Drive. From there, it can be downloaded locally and further processed in R or Python.
// Export the combined image to Drive
Export.image.toDrive({
  image: combinedMonthlyNDVI,
  description: 'Pakistan_Monthly_NDVI_2023',
  folder: 'Remote Sensing',
  scale: 500,
  crs: 'EPSG:4326', // Specifying WGS 84 as the CRS
  region: pakistan.geometry(),
  fileFormat: 'GeoTIFF',
  formatOptions: {
    cloudOptimized: true
  },
  maxPixels: 1e13  // Increase maxPixels if necessary
});
That’s it!
Feel free to reach me out if you got any questions.
Muhammad Mohsin Raza
Data Scientist
My research interests include disease modeling in space and time, climate change, GIS and Remote Sensing and Data Science in Agriculture.